- Info was updated
- just now
- Days on Market
- 14
- Views
- N/A
- Saves
- N/A
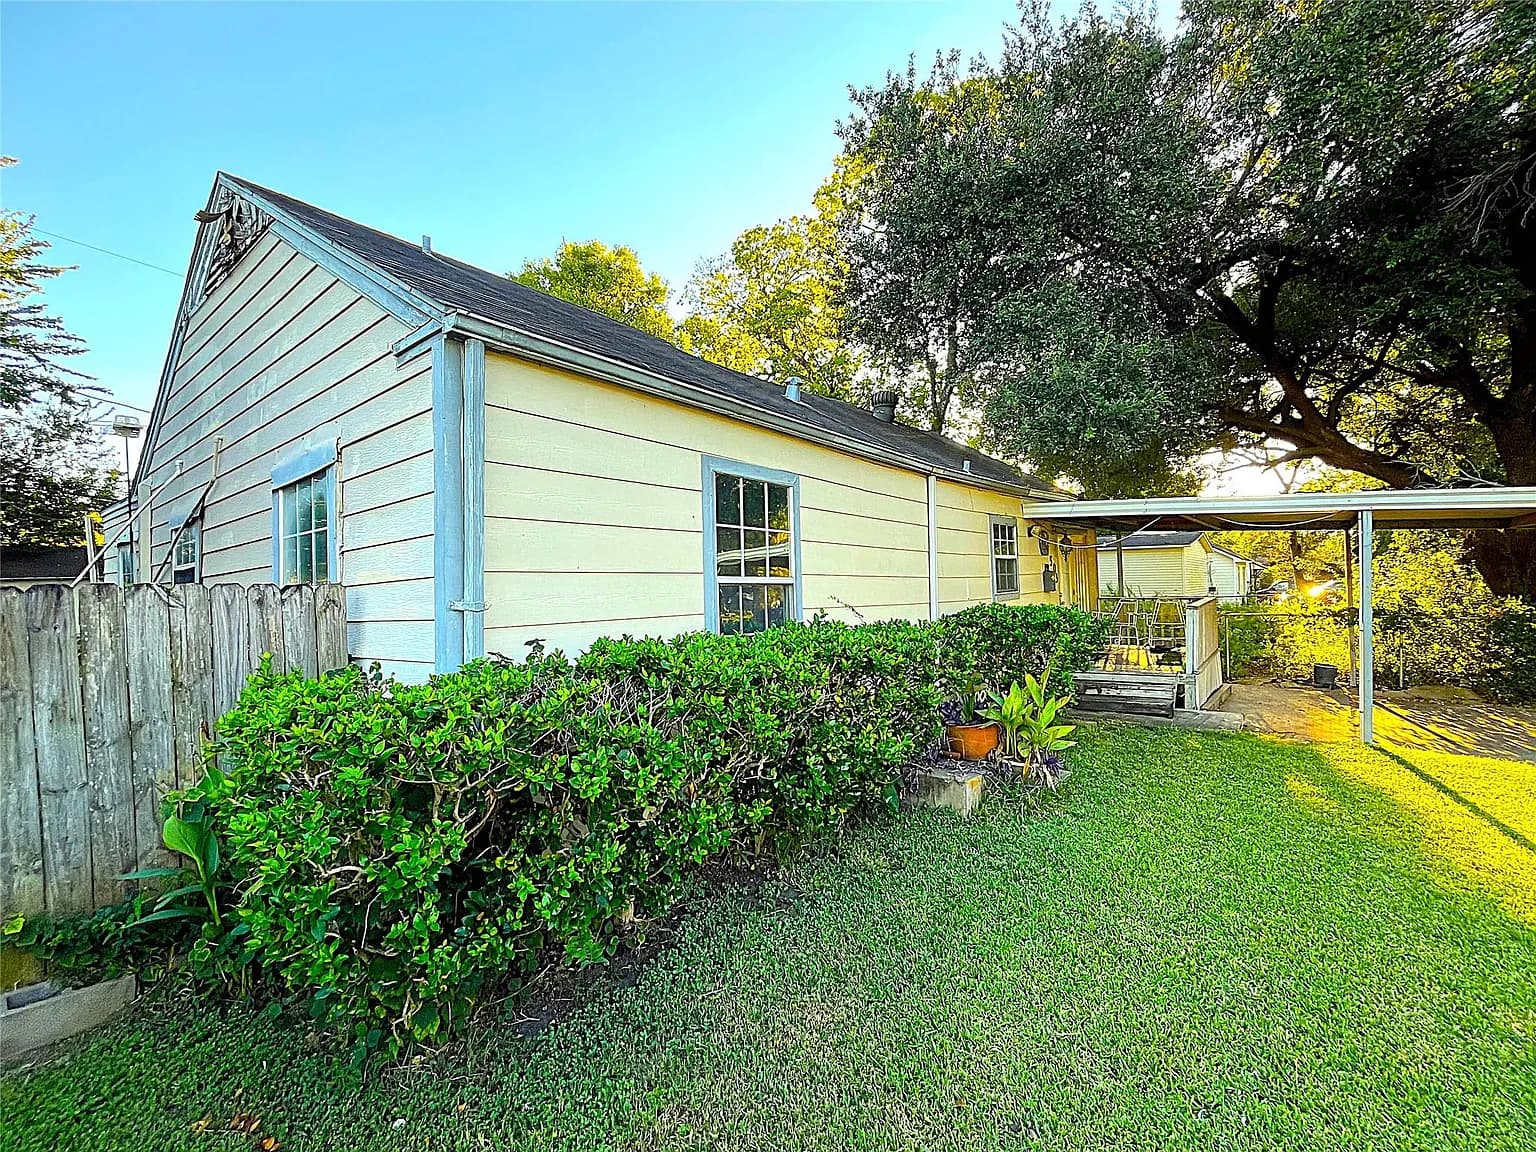
- Address:
- 503 W Pitts Ave, Pasadena, TX 77506
- Market Score
- --
- Cap Rate
- --
- Rent to Price
- --
- School Score
- --
- Bed & Bath
- 4bd / 2ba
- Area
- 2,176 sqft
- Property Type
- Single Family
- Property Condition
- Turn-Key
Long-Term Rental See on Zillow
- Rental Income
- $2,022/Mo
- L-T Rental Confidence
- Low
Short-Term Rental See on AirBnB
- Rental Income
- $3,047/Mo
- S-T Rental Confidence
- None
Property Report
10 seconds to generate
- Area
- 2176 sqft
- Bed
- 4
- Bath
- 2
Property Details
- HOA Cost
- None
- Year Built
- 1941
- Price Per Square Foot
- $55 /sqft
- Lot Size
- N/A
- Property Parking
- N/A
- Public Transport Score
- N/A
- Bike Score
- N/A
- Walkability
- N/A
Seller Description
Schools
- School District:
- N/A
Property Map
Financials Summary
- ROI
- N/A
- Total Income
- $2,022
- Total Expenses
- $936
- Total Appreciation
- N/A
- Selling Fee
- 6%
Income
Monthly
| Monthly Income | $2,022 |
Total Income
$2,022
Expenses
Monthly
| Mortgage | $0 |
| PMI | $0 |
| Maintenance | $0 |
| Cap Ex | $0 |
| Property Tax | $0 |
| Property Management | $0 |
| Home Insurance | $0 |
| HOA | $0 |
| Vacancy | $0 |
Total Expenses
N/A
Appreciation
30 yrs
| Annual House Appreciation | 3% |
Total Appreciation
N/A
Return on Investment
30 yrs
| Total Initial Cost | $0 |
| Total Expenses | N/A |
| Total Appreciation | N/A |
| Selling Fee (6%) | $0 |
| Total Income | N/A |
Total ROI
N/A
Cash-on-Cash
3.41%
Cap Rate
N/A
Cash Flow
Expense Breakdown
Appreciation Over Time
- Appreciation Rate
- 3%
Income Over Time
- Income Rate
- 5%
Rental Opportunities
Zillow
Long-Term Rental Information
- Average Monthly Revenue
- $2,022
- Average Monthly Expense
- N/A
- Monthly Property Tax
- N/A
- Estimated Monthly Profit
- N/A
- Rental Confidence
- Low
Airbnb
Short-Term Rental Information
- Average Monthly Rate
- $3,047
- Average Monthly Expense
- N/A
- Average Nightly Rate
- $169
- Average Monthly Occupancy
- 60%
- Estimated Monthly Profit
- N/A
- Rental Confidence
- None